
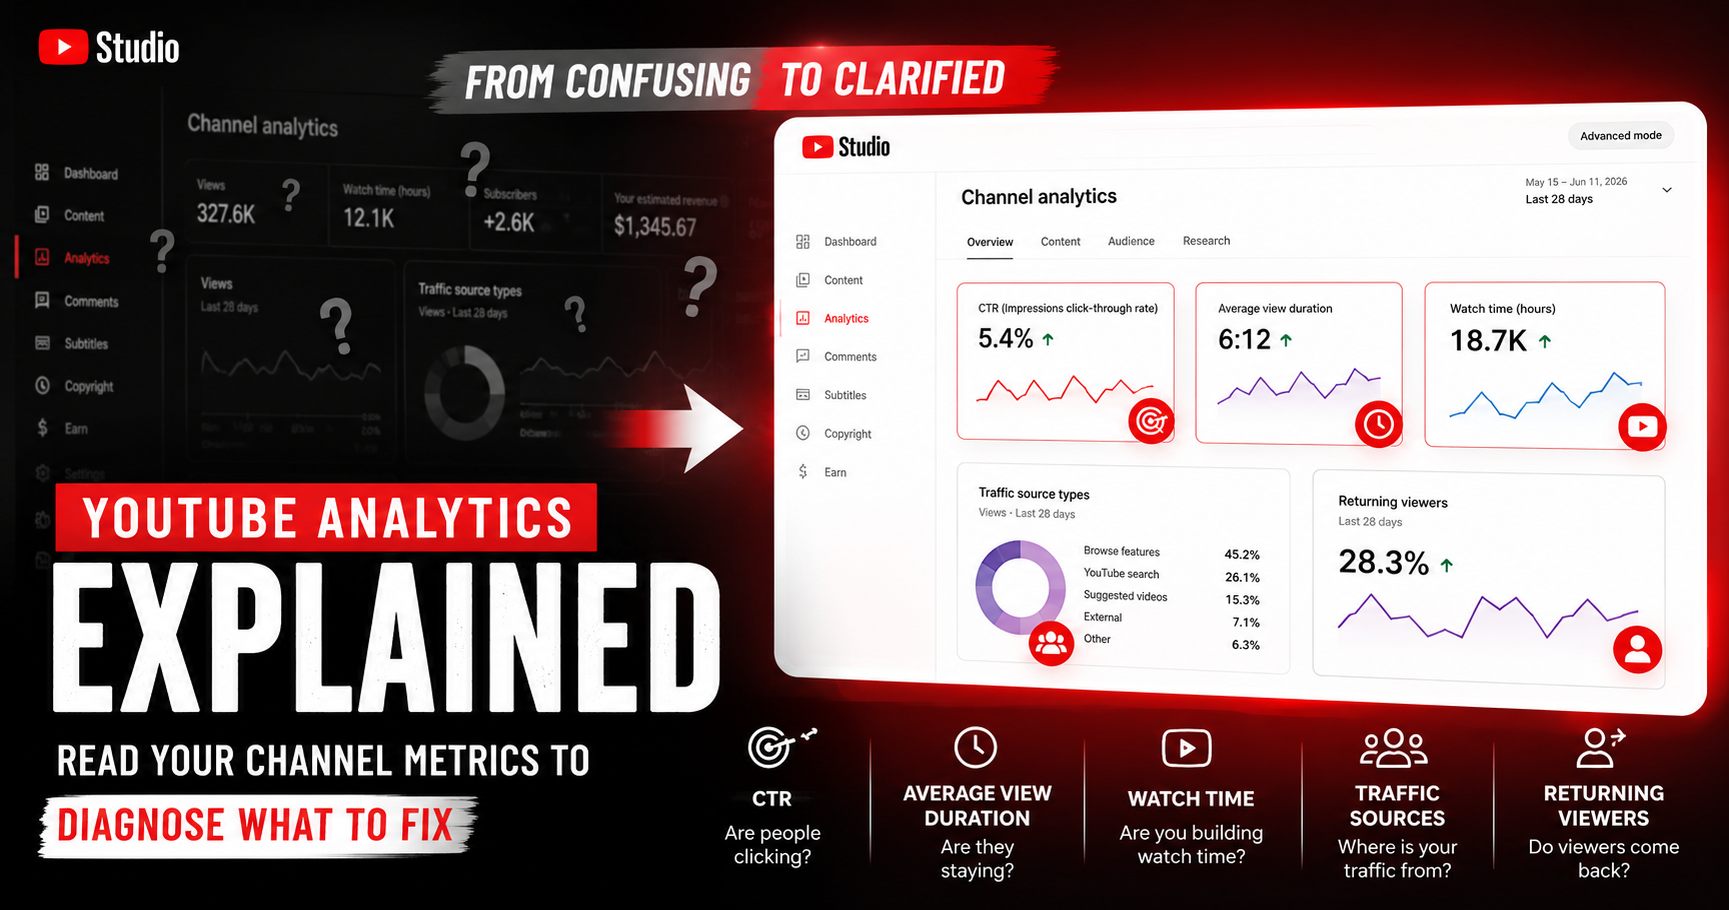
YouTube Analytics Explained: How to Read Your Channel's Numbers
You open YouTube Studio. There's a dashboard. There are charts, percentages, numbers ticking up or down, tabs you've never clicked. And no clear sense of which of those numbers actually matter - or what to do about any of them. If that's where you are, this guide is for you.
Learning how to read your YouTube analytics is the skill that turns guesswork into a system. Done right, it tells you exactly what's working, what's not, and what to fix in your next upload. Done wrong - chasing vanity counts, comparing yourself to other channels - it just creates anxiety. This guide focuses on the right way: reading your own first-party data to diagnose your own channel.
Quick Answer
Focus on a small set of metrics that actually drive growth: click-through rate (CTR), average view duration or retention, watch time, traffic sources, and returning viewers. Ignore vanity counts and comparisons to other channels. Read these numbers together, not in isolation - patterns across metrics tell you whether the problem is packaging, content, or discoverability, and what to fix next.
Why Do Most Creators Misread Their YouTube Analytics?
Three common mistakes. First, chasing vanity counts - total views and subscriber numbers feel important but don't tell you what to change. Second, reading metrics in isolation - a single number is meaningless without context from the others. Third, comparing your channel to strangers - different niches, different content types, different baselines. Your numbers only mean something against your own historical performance, not a competitor's.
Where Do You Find Your YouTube Analytics?
Your analytics live in YouTube Studio - accessible at studio.youtube.com on desktop, or through the YouTube Studio mobile app. The Overview gives you the top-line trend. Deeper sections (Reach, Engagement, Audience, Revenue if monetized) break the numbers down by topic - how viewers found you, how long they watched, who they are, and how the channel earns. Tab names occasionally shift as YouTube updates Studio, but the metrics themselves stay consistent.
Which YouTube Metrics Actually Matter?
Not all numbers carry equal weight. These are the ones worth your attention:
- Impressions & Click-Through Rate (CTR): impressions tell you how often your thumbnail was shown; CTR tells you what fraction of those clicked. Together they measure your packaging - title and thumbnail. Most niches sit around 4-10% CTR; what matters is YOUR baseline, not a universal target.
- Average View Duration (AVD) & Average Percentage Viewed: how long viewers actually watch, in time and as a share of the video. These measure content and pacing - does the content deliver what the title promised?
- Audience Retention Graph: the curve showing where viewers stay, drop off, and re-engage. The first 30 seconds reveals hook strength; mid-video dips reveal slow moments; spikes show key moments worth doubling down on.
- Watch Time: total minutes watched. This is YouTube's strongest overall value signal - a strong watch time number tells the algorithm your content holds attention.
- Traffic Sources: where viewers found you - browse, suggested, search, external, or notifications. Each source signals a different growth lever (more on this in a moment).
- Returning vs New Viewers & Subscribers: returning viewers measure loyalty; new viewers measure discovery. Healthy growth needs both, but the ratio reveals your channel's stage.
- RPM / Revenue (monetized creators): your revenue per thousand views and overall earnings. This is the bottom-line value signal - useful for optimizing toward niches, formats, and content lengths that monetize best.
How Do You Read Metrics Together to Diagnose Your Channel?
The real power of analytics is in reading the numbers TOGETHER. Three common diagnostic patterns:
- High impressions + low CTR = packaging problem. YouTube is showing your video, but viewers aren't clicking. Fix: rewrite the title, redesign the thumbnail.
- Strong CTR + low retention = content or expectations problem. Viewers click but bounce. The title promised something the video didn't deliver, or the pacing lost them. Fix: tighten the opening, align title with content, cut slow segments.
- Low impressions = topic or discoverability problem. YouTube isn't showing the video much in the first place. Fix: stronger keywords, more searchable topic, better metadata.
A Simple Per-Video Review Workflow
After every upload, run this 4-step check at the 7-day mark (when initial data settles):
1. Open the video's analytics. Note CTR, AVD, watch time, and top traffic source.
2. Compare against your channel's last 10-20 uploads. Is this video above or below your typical CTR? Above or below your typical retention?
3. Diagnose using the patterns above. Packaging, content, or discoverability - which is the bottleneck?
4. Apply the fix to your NEXT upload. Test one variable at a time. After your next 3-5 uploads, compare again - did the fix lift the metric?
Pair this with a metadata scan - see how to check your YouTube video's SEO score for the SEO side of the diagnosis.
New Channels vs Established Channels: What Should You Watch?
Small channels have noisy data - a single video can swing your averages by 50%. Don't over-read individual videos. Instead, watch CTR and retention trends across your last 10-20 uploads. Look for direction, not absolute numbers.
Established channels have richer data. Segment by topic, video length, day-of-week, and traffic source - then compare each segment against your own baseline to spot what's outperforming or underperforming. The Audience section also shows when your viewers are online - see best time to post on YouTube for how to use that for scheduling. For tracking labeled or AI-content videos specifically against baseline, see tracking each video against your baseline.
How YouSEO Turns This Into a System
Reading your analytics manually works, but it's slow and easy to miss patterns. YouSEO turns the process into a structured workflow with three connected tools:
- Channel Analytics - see your numbers and trends against your own historical baseline, not generic benchmarks. The dashboard surfaces what's moving in your channel and flags videos that deviate significantly from your norm.
- Analytics Optimize - converts your numbers into specific, prioritized fixes. Low CTR? It points to the title and thumbnail to update. Low retention? It points to which uploads to re-cut or repackage.
- YouSEO AI - interprets the data and guides your next move. Ask it what to do about a low-performing upload, and it analyzes the metric pattern, identifies the bottleneck, and recommends the action.
Together, these turn analytics from a wall of numbers into a system that tells you what to do next.
A Real Diagnosis Example
Consider a real pattern. A creator uploads a tutorial that gets strong impressions but only 2.8% CTR - well below their channel's 6% baseline. Retention is fine for the few who do click. The diagnosis is clean: this is a packaging problem, not a content problem. The video itself is good; the title and thumbnail aren't earning the click.
The creator rewrites the title to lead with the payoff and redesigns the thumbnail with higher contrast. Within 14 days, CTR climbs to 5.4% - almost back to baseline. Impressions stay roughly flat (YouTube hasn't suddenly decided to show it more), but more of those impressions now convert into clicks. Watch time follows. The same video, the same content - fixed by reading the metrics together instead of guessing.
Frequently Asked Questions About YouTube Analytics
Which YouTube metric matters most?
There isn't one. The most useful metrics depend on what you're diagnosing: CTR for packaging, average view duration for content, traffic sources for discovery, returning viewers for loyalty. Reading them together is what matters - no single number tells the full story.
What's a good CTR or retention rate on YouTube?
Most niches see 4-10% CTR and 40-60% average percentage viewed, but these vary widely by topic, video length, and traffic source. The only meaningful comparison is against your own channel baseline. A 5% CTR is great for some creators and weak for others - context is everything.
How often should I check my YouTube analytics?
Daily checks lead to over-reacting to noise. Better: a structured 7-day review after each upload, plus a weekly look at trends across your last 10-20 videos. Avoid the home dashboard's daily ticker if it makes you check obsessively - focus on patterns, not single-day swings.
Why are my YouTube views suddenly dropping?
Run the diagnosis. If impressions dropped, it's a discoverability issue (YouTube isn't surfacing your videos) - check whether recent uploads underperformed and dragged channel signals down. If CTR dropped on stable impressions, it's packaging. If retention dropped on stable CTR, it's content. Identify which signal moved first to find the root cause.
What's the difference between watch time and views?
Views count how many times your video was started. Watch time counts the total minutes viewers actually watched. A million views with 30-second average watch time signals weak content; 100,000 views with 6-minute average watch time signals strong content. YouTube weights watch time far more heavily in distribution decisions.
Should I compare my channel's analytics to other channels?
No. Different niches, audiences, video lengths, and content types make cross-channel comparisons misleading. The only meaningful comparison is against your own historical performance. Other channels' public stats won't tell you what to change about yours.
Stop Guessing. Start Reading.
Your analytics are already telling you what to fix. The skill is learning to read them - the right ones, together, against your own baseline. Watch CTR and retention. Diagnose packaging vs content vs discoverability. Apply one fix at a time. Measure the lift. Repeat.
Stop guessing at your numbers - see them clearly with Channel Analytics, get specific fixes from Analytics Optimize, and let YouSEO AI guide your next move. Read your data, find what's working, and act on it. Try YouSEO free today.